
Vitamin D has a peculiar personality: it can be remarkably helpful, yet stubbornly variable in how well the body absorbs it. One of the most influential—and often misunderstood—modifiers of this process is whether vitamin D is consumed with food. When you pair vitamin D with a meal, the digestive environment changes the “rules of engagement” for absorption. The result is often a different absorption trajectory, which can be visualized through clear graphs comparing “with food” versus “without food” scenarios.
Why “absorption” behaves differently: fat-soluble dynamics
Vitamin D belongs to the fat-soluble vitamin family. Fat-soluble nutrients are absorbed through pathways that are intimately tied to lipids, bile secretion, and the formation of micelles. In plain terms, the intestine acts like a logistics hub: if it has sufficient dietary fat, it dispatches bile and creates transport-ready particles that escort vitamin D into the body’s absorption channels more efficiently. If the meal is absent—or nearly fat-free—the transport system can run at a lower capacity.
This is why graphs often show a noticeable divergence: “with food” curves typically rise faster and reach higher post-ingestion peaks, while “without food” curves may rise more slowly or plateau at a lower level. Short sentences help here: less dietary context, less absorption momentum.
What graphs usually compare: peak levels, time-to-peak, and exposure
Most absorption graphs for vitamin D focus on three measurable qualities:
1) Peak concentration (Cmax): the highest blood level reached after dosing. “With food” patterns frequently produce a higher Cmax.
2) Time to peak (Tmax): how long it takes to reach the maximum. Meals can shorten this interval, reflecting more efficient gastrointestinal handling.
3) Total exposure (AUC): the area under the curve, representing the overall “absorption yield” across time. “With food” often increases the AUC, indicating not just a higher peak, but sustained availability.
In practical narrative terms: one graph can tell a story of speed, height, and endurance.
Vitamin D forms and why meals can amplify them
Vitamin D supplements typically come as either vitamin D2 (ergocalciferol) or vitamin D3 (cholecalciferol). Both are fat-soluble, but real-world absorption can still vary based on formulation: oil-based capsules, liquid drops, and emulsified versions can differ dramatically in how readily they integrate with digestive fats.
When vitamin D is taken without food, the body must rely on baseline bile activity and residual lipid processing. When taken with food, especially meals containing dietary fat, the intestine is primed to package nutrients into micelles. That priming can function like a backstage crew that moves faster when the stage is busy.
Graphs that compare “with food” and “without food” often reveal not only a magnitude difference, but a qualitatively different slope—meaning the curve’s shape changes, not merely its height.
“With food” absorption: the common graph signature
In a typical “with food” absorption graph, you often see:
• A steeper rise shortly after ingestion.
• A higher peak corresponding to more efficient entry into circulation.
• A slower decline that can translate into greater overall exposure.
This is consistent with improved micellar solubilization and better lymphatic transport of fat-soluble compounds. The graph may look like a wave with greater amplitude and a smoother crest. Short and long sentences can coexist here: “The crest arrives sooner.” “The descent lingers.” Together, they communicate the shift in absorption kinetics.
“Without food” absorption: slower uptake and a flatter curve
When vitamin D is taken on an empty stomach, absorption can still occur—but the process may be less efficient. Without the post-meal surge in bile release and lipid digestion, micelle formation may be delayed or reduced. Consequently, the curve may show:
• A gentler slope in the early phase.
• A lower peak reflecting less vitamin D successfully reaching systemic circulation.
• A possible delay where the curve takes longer to approach its maximum.
Some graphs also show a more abrupt fall-off after the peak. That pattern suggests a reduced reservoir effect—less sustained movement from the gut into the blood. It’s like trying to move cargo through a smaller port: the ships can still arrive, but the logistics are less synchronized.
How to read a vitamin D absorption graph like a detective
If you’re scanning comparative charts, look beyond the headline curve color. Details matter.
First: identify the axes. The y-axis typically reflects concentration in blood (or sometimes a normalized response). The x-axis usually tracks time after ingestion.
Second: locate key landmarks—rise time, peak height, and the descent segment. These correlate with the kinetics that clinicians and researchers care about.
Third: check whether the graph is dose-normalized. Two curves that look different may be driven by different dosing rather than meal presence.
Fourth: watch for individual variability. Even in controlled settings, absorption can be heterogenous due to differences in bile status, baseline fat digestion, body composition, and gut physiology.
Short sentence tip: graphs are maps, not mirrors. They summarize a pattern, but they don’t capture every person’s physiology.
Edge cases that can blur the “with vs without food” separation
Although meal presence often improves absorption, real life includes confounders that can attenuate the gap between curves:
• Meal composition: fat content and total calories influence bile secretion and micelle formation. A small snack may improve absorption less than a full meal.
• Formulation technology: emulsified or oil-based preparations can behave more like “with food” even when taken fasting.
• Gastrointestinal health: conditions affecting bile flow or fat absorption can distort the kinetics, potentially flattening curves or delaying peaks.
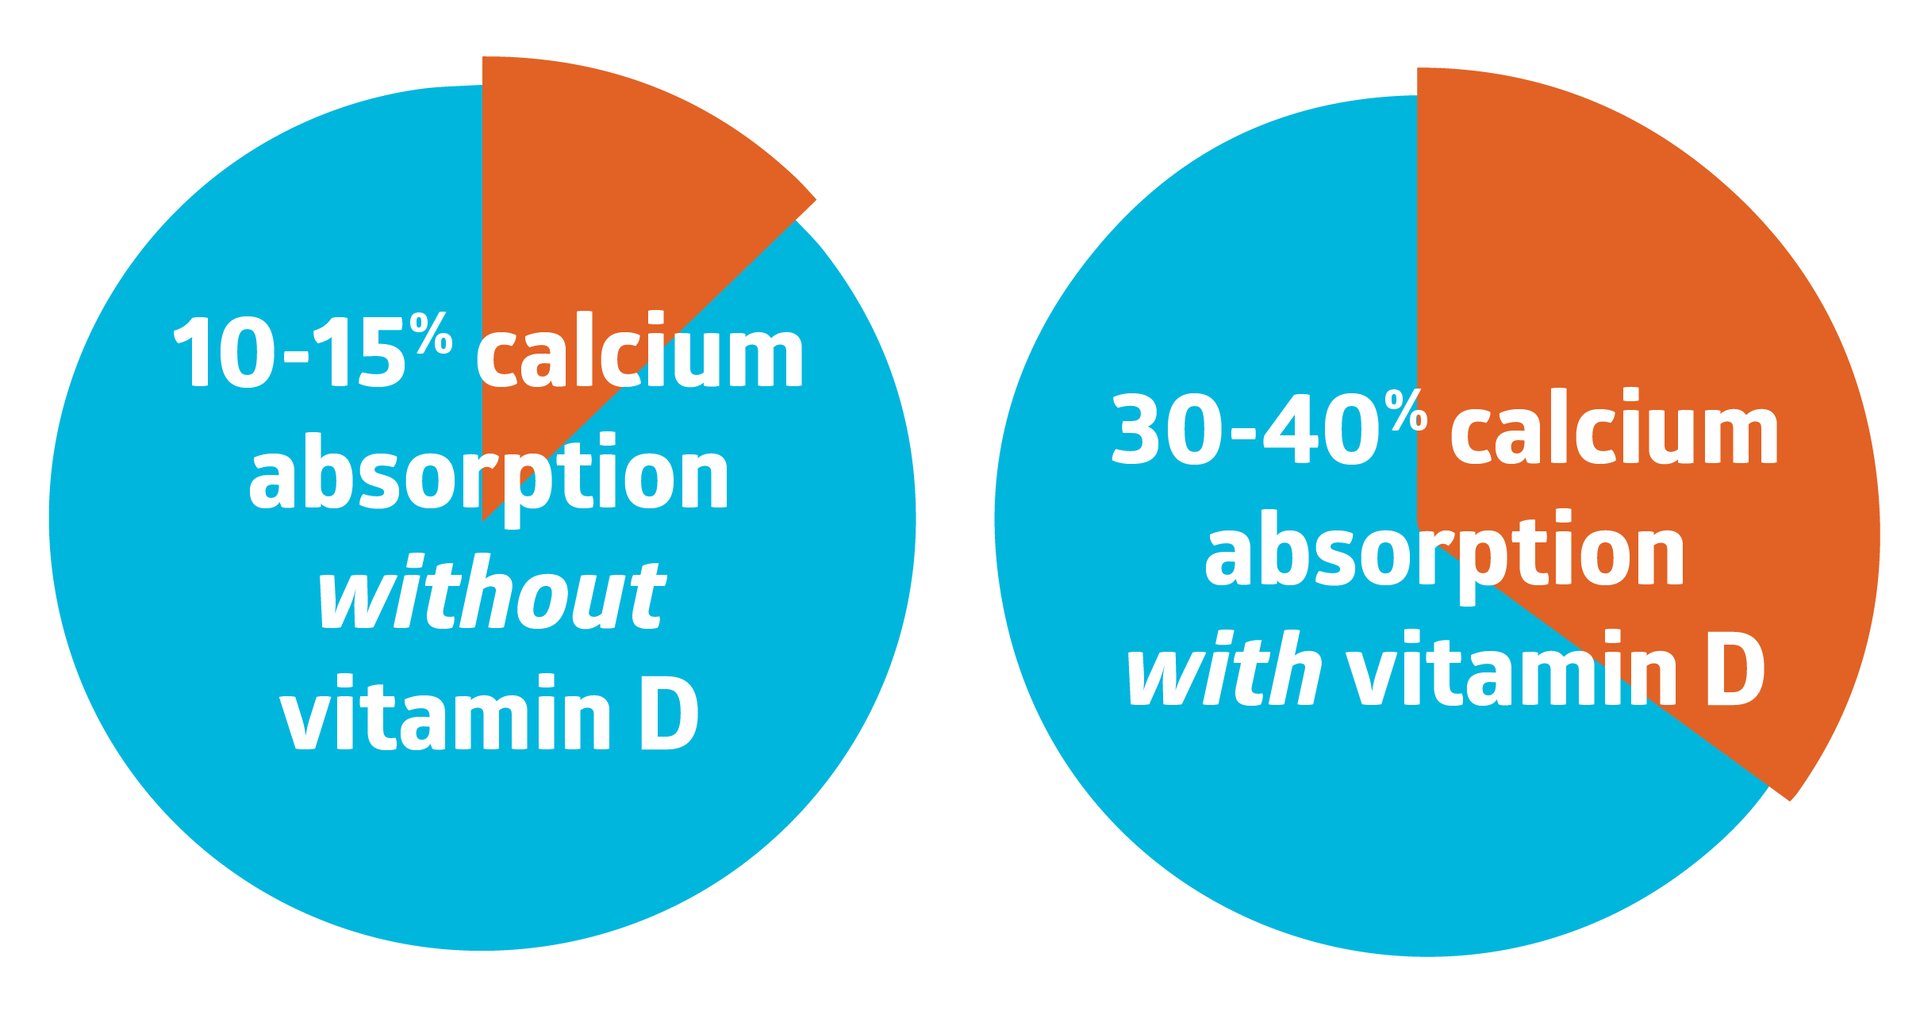
• Concomitant nutrients: calcium and other dietary fats can indirectly influence the environment in which vitamin D is packaged and absorbed.
These elements can create graphs where curves overlap more than expected, or where “without food” shows a surprising bump.
Different content types you may encounter: what each one teaches
Readers typically meet the vitamin D absorption story through three content modalities:
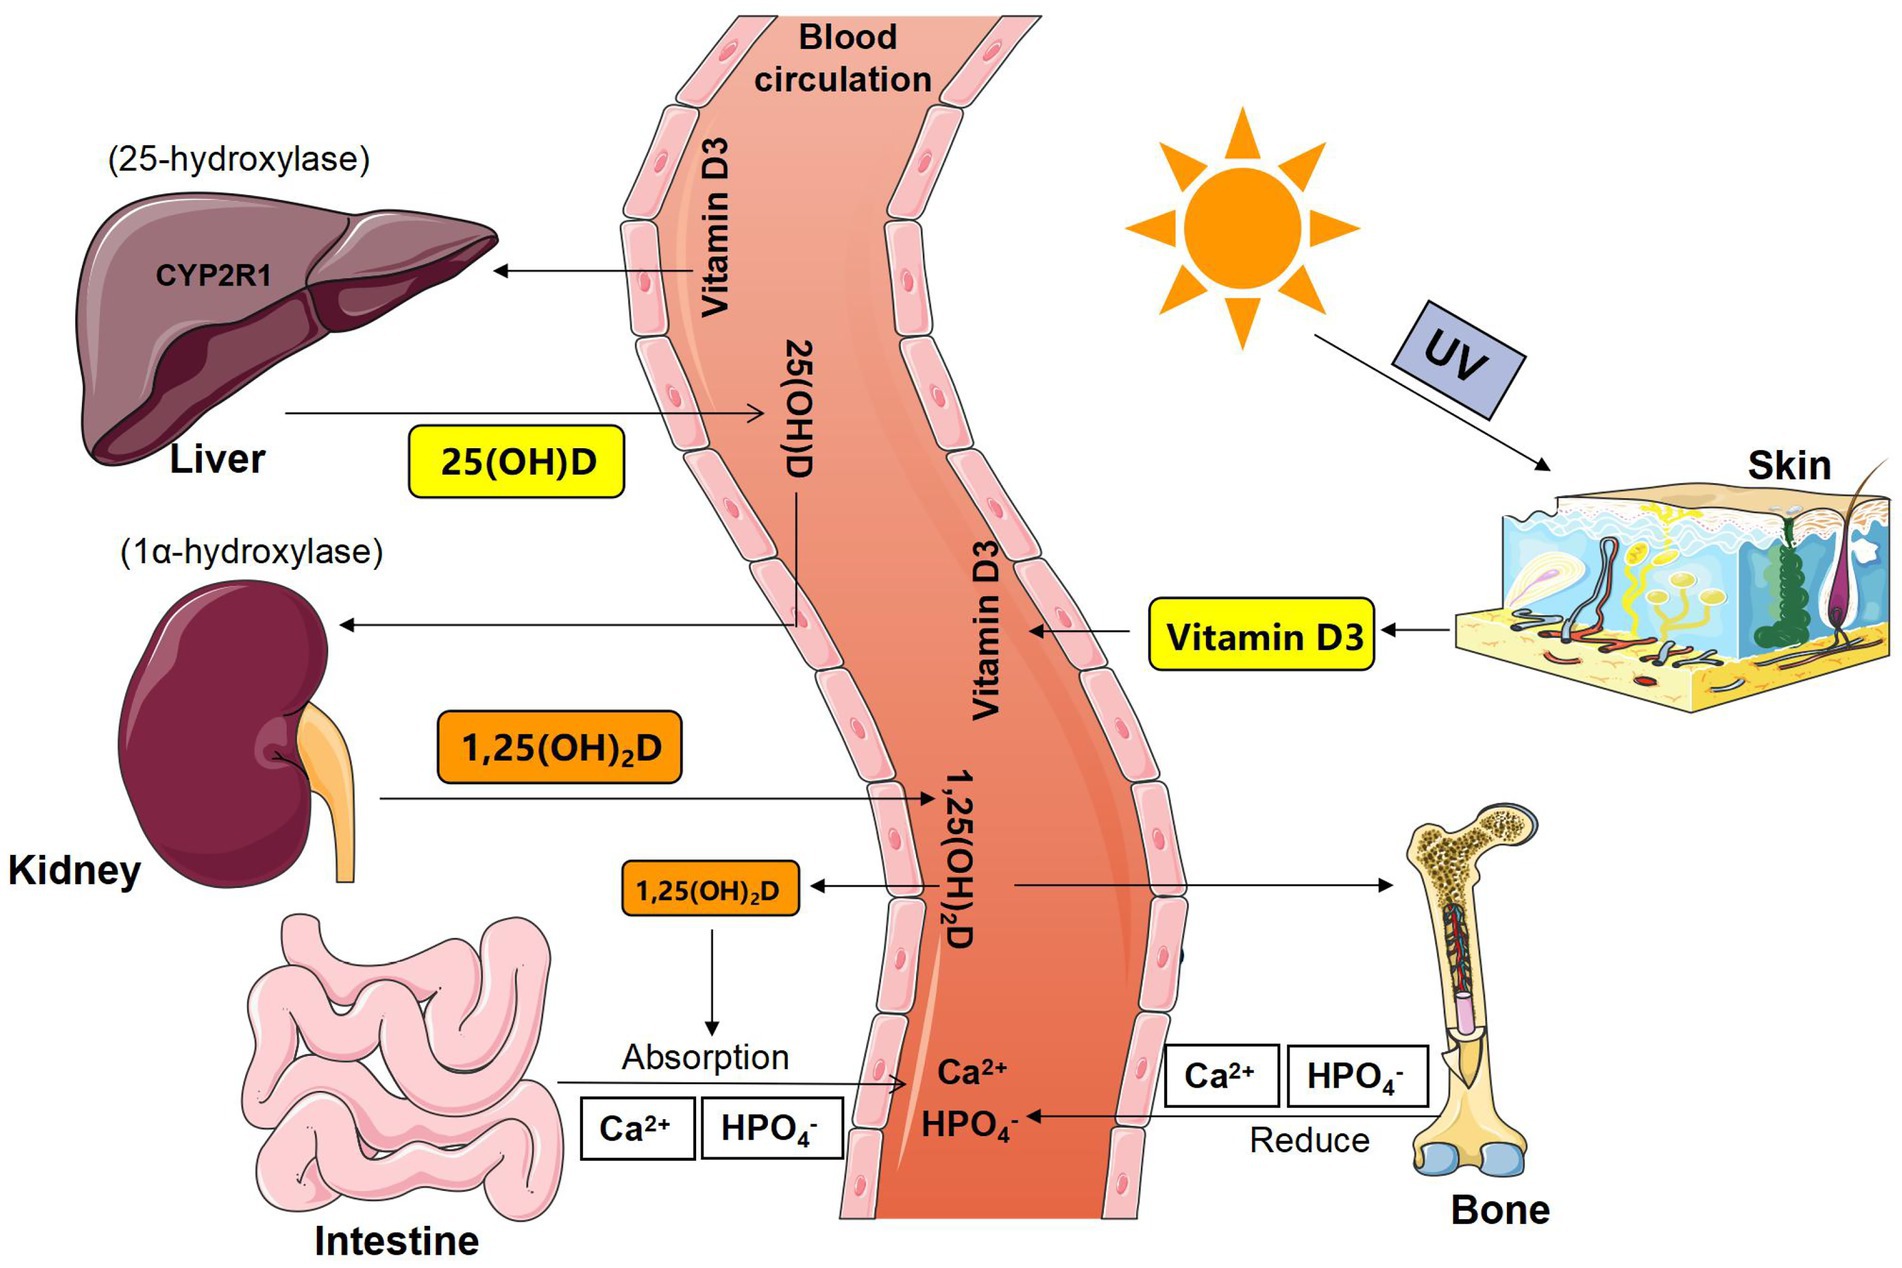
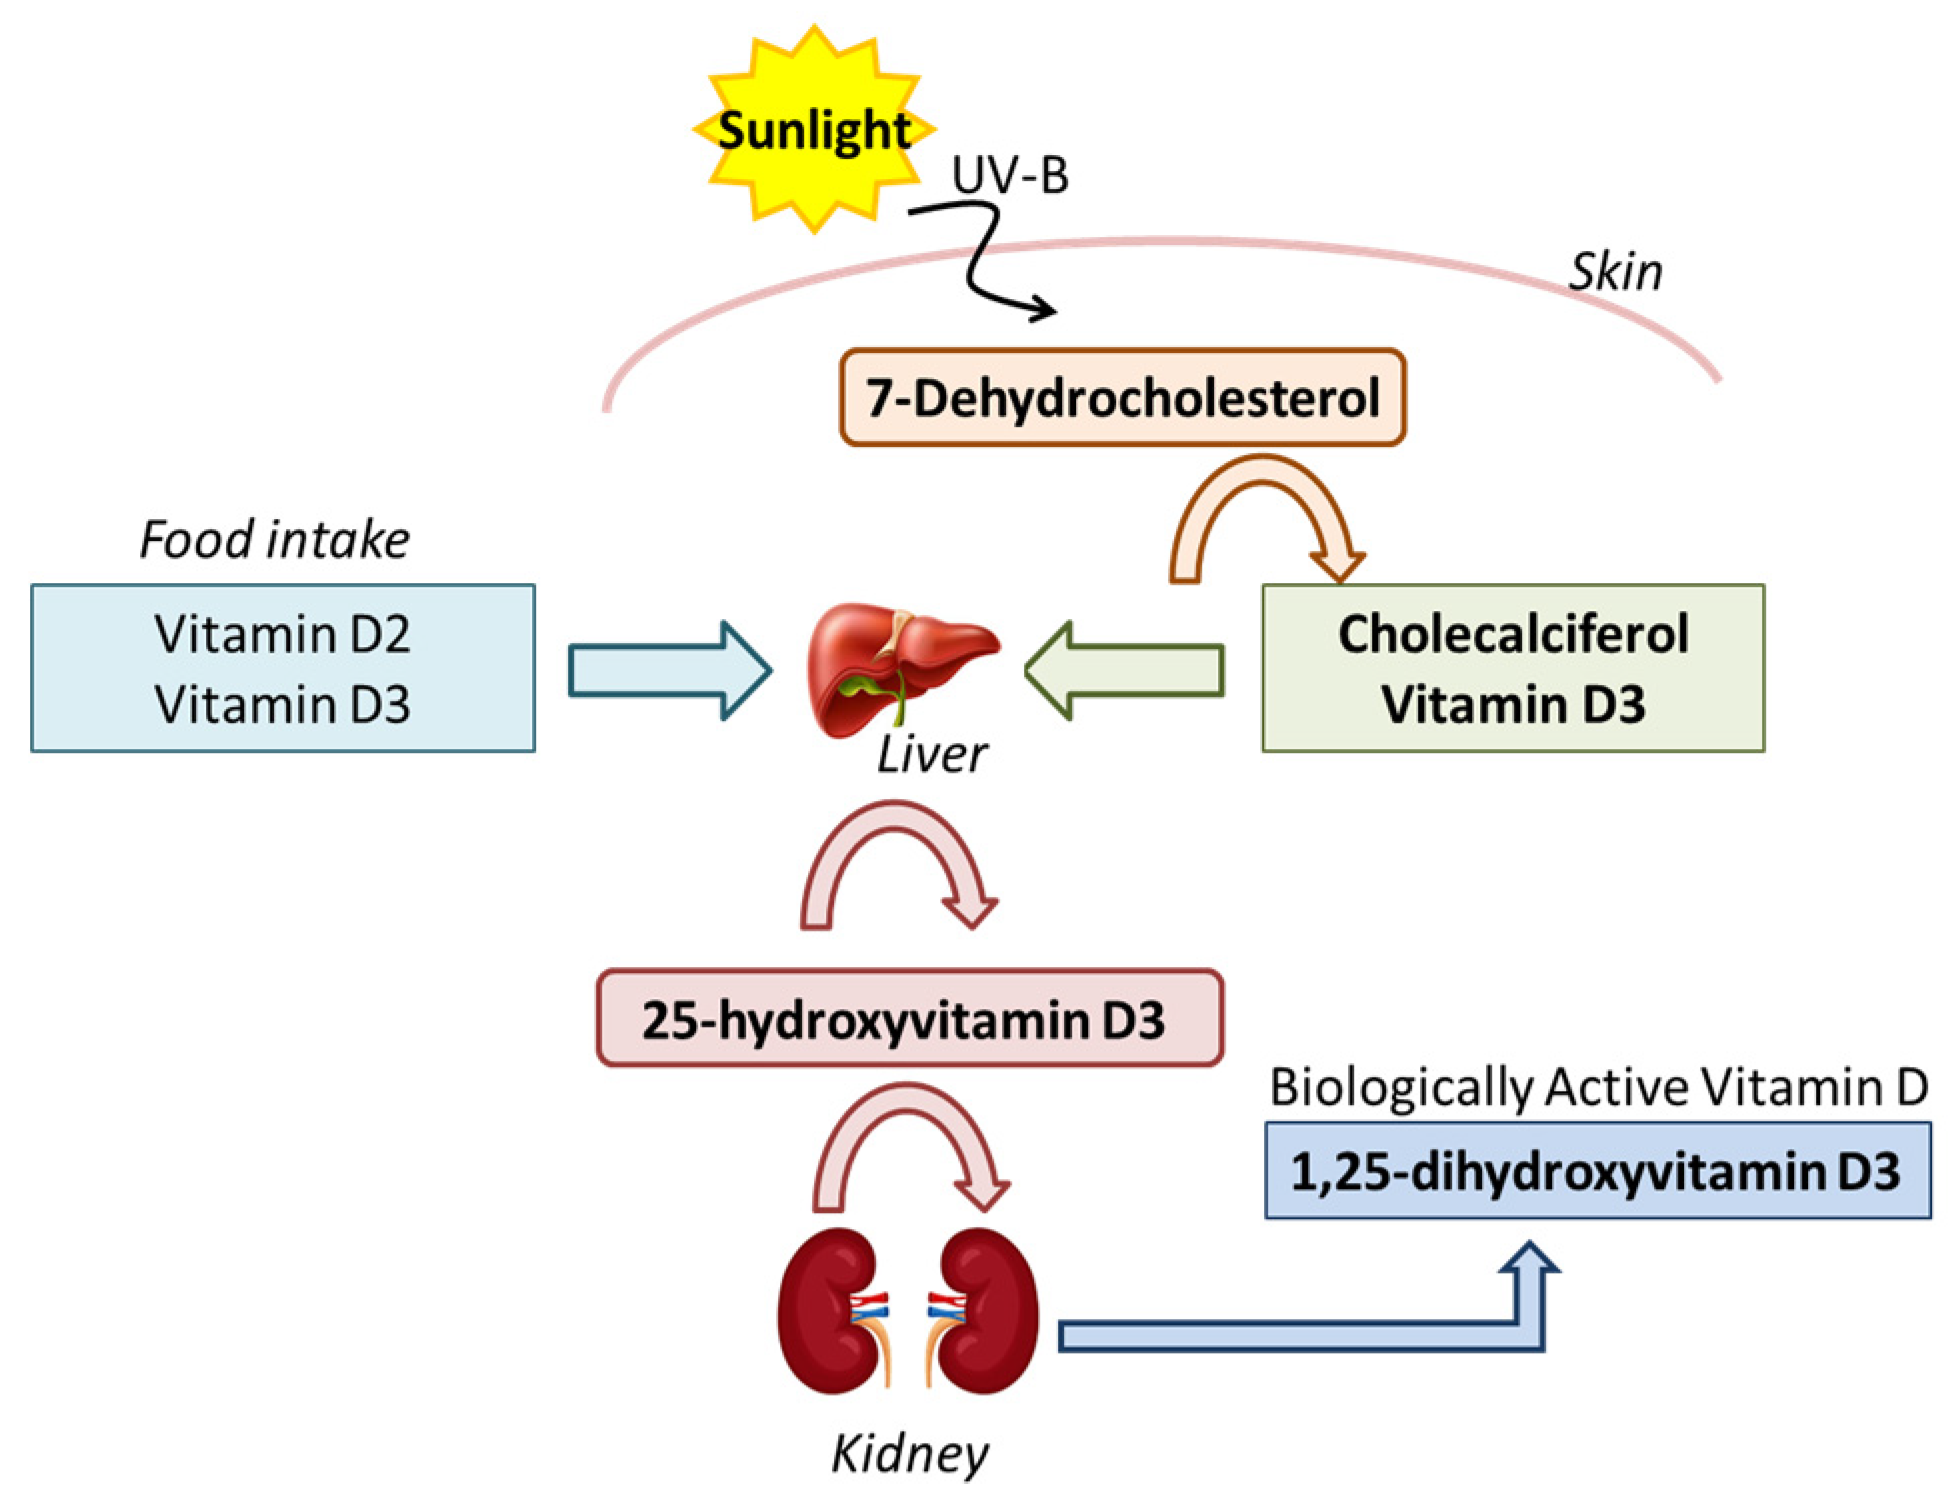
1) Mechanism diagrams: These focus on the biological choreography—how vitamin D is activated, how it engages calcium-related pathways, and why intestinal context matters. Expect them to be explanatory and visual, like a blueprint. They help you build intuition for why graphs change shape.
2) Graph-heavy comparisons: These are optimized for kinetics. They foreground Cmax, Tmax, and AUC. Expect concise interpretation—often technical—so it helps to know how to read axes and peak markers.
3) Practical educational articles: These translate kinetics into habits. Expect advice framed around consistency, pairing with meals, and minimizing extremes of dosing schedules. They often use narrative examples rather than pure measurements.
When these content types work together, the story becomes cohesive: mechanisms explain the “why,” graphs reveal the “what,” and practical guidance describes the “how.”
Takeaway: graphs are telling you about timing, not just success
The difference between vitamin D absorption “with food” and “without food” is not merely a matter of higher versus lower. Graphs often suggest altered kinetics—faster mobilization, a higher systemic peak, and sometimes greater total exposure. That means the same supplement dose can yield a different physiological timeline.
If a graph shows a sharper rise and stronger peak for the “with food” condition, it’s signaling more than convenience. It’s reflecting a digestive environment that improves the delivery machinery—micelles, bile dynamics, and transport pathways—so vitamin D can enter circulation more effectively.
In the end, the graph is a chronicle. It documents how your meal can turn a slow trickle into a more reliable stream.


