Your vitamin D blood test can feel like a cryptic scorecard—numbers without context, units without intuition, and ranges that seem to shift depending on whom you ask. Yet interpreting the results doesn’t have to be mysterious. In 2025, the most useful approach is to read the test as a clinical snapshot: a moment in time that reflects absorption, sun exposure, diet, skin physiology, and sometimes medication effects. This guide walks you through what your vitamin D result typically means, what different report sections may contain, how “optimal” can differ by person, and how to move from a lab value to a sensible plan.
1) What the Test Actually Measures (25(OH)D vs. Other Variants)
Most routine vitamin D testing reports 25-hydroxyvitamin D, often written as 25(OH)D. This is the body’s main storage form and the best proxy for overall vitamin D status. You’ll usually see a single number, sometimes accompanied by additional notes such as sufficiency thresholds or interpretation hints.
Less commonly, a lab may also mention other measures—such as 1,25-dihydroxyvitamin D—which behaves differently and can mislead if you treat it like the primary “vitamin D level.” In practical terms: if you want the interpretable result that most clinicians use for prevention and supplementation decisions, you’re generally looking for 25(OH)D.
If your report lists units, pay attention. The same concentration can look different depending on whether your lab reports ng/mL or nmol/L. Confusion here is surprisingly common and can cascade into dosing errors.
2) Units, Conversion, and Why Your Number Might “Look Wrong”
Vitamin D is often reported as:
ng/mL (common in the United States) or nmol/L (common internationally).
A quick conversion you may encounter in clinical contexts is:
1 ng/mL ≈ 2.5 nmol/L.
For example, a result of 20 ng/mL is roughly 50 nmol/L. If your report compares you to a range using one unit system while you mentally interpret another, the mismatch can turn a borderline result into an apparently severe one. Treat the lab’s units as the anchor point, not an assumption.
3) Typical Reference Ranges (and the Reality Behind “Normal”)
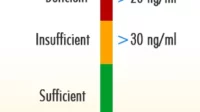
Reference ranges are statistical guideposts, not universal verdicts. A lab might categorize vitamin D into tiers such as:
Deficient, insufficient, and sufficient.
Some common clinical cutoffs you’ll hear include:
Deficiency often around < 20 ng/mL (or ~50 nmol/L).
Insufficiency might sit roughly between 20–30 ng/mL (50–75 nmol/L).
Sufficiency often considered ≥ 30 ng/mL (≥ 75 nmol/L), though “optimal” can vary by age, bone health goals, and comorbidities.
Short sentences matter here: “Normal” on paper doesn’t always mean “ideal for your physiology.” Your body may need a higher or steadier level if you have malabsorption risks, limited sun exposure, or conditions affecting bone metabolism.
4) Content Readers Often Find on the Report (and How to Interpret Each Piece)
Beyond the main vitamin D number, your report may contain supporting content. Here’s what to look for:
Reference interval: The lab’s stated “normal” range. Treat it as a starting point.
Method: Different lab assays can vary slightly. Most people should still compare trends rather than obsess over tiny differences.
Flagging or interpretive comments: Some reports will label “low,” “adequate,” or similar wording. This can be convenient, but always connect it to the numeric value and units.
Date and specimen type: Whether the sample was fasting is usually less relevant for vitamin D than consistency over time, but timing can affect overall metabolic context.
Some labs include additional tests such as calcium, phosphorus, or parathyroid hormone (PTH). Those can turn your vitamin D result from a single number into a narrative about your bone–mineral axis.
5) What Low Vitamin D Can Signal (Beyond “You Need Supplements”)
A low 25(OH)D level often indicates reduced vitamin D availability. Common contributors include inadequate sun exposure, higher body fat (vitamin D can become sequestered in adipose tissue), darker skin pigmentation (more melanin reduces vitamin D synthesis), and dietary insufficiency.
However, low results can also reflect functional issues such as malabsorption. Conditions affecting the small intestine—whether due to gastrointestinal disorders or certain surgeries—can blunt absorption even when intake is adequate.
Some medications can lower vitamin D status indirectly. Others can alter calcium handling, which changes the downstream story. The essential point: low vitamin D is rarely only about “outdoor time.” It may be about physiology, absorption, and metabolism collaborating in a less-than-ideal configuration.
6) Vitamin D Deficiency vs. Insufficiency vs. “Sufficient”: How the Tiers Change the Plan
Think of the tiers as different chapters, not different diagnoses. When levels are deficient, clinicians often prioritize correcting the deficit promptly to reduce risk to bone health. When levels are insufficient, the strategy may be more gradual—boosting intake and monitoring to confirm upward trajectory.
When levels are labeled sufficient, interpretation shifts toward stability. The question becomes: can you maintain this level through lifestyle, seasonal sun variation, and dietary habits? For some people—especially those with risk factors—“maintenance” can require a structured supplement routine, not just sporadic changes.
One more nuance: a person can be within a “sufficient” range but still show biochemical signs that vitamin D signaling is suboptimal. That’s where PTH and calcium-related results become particularly valuable.
7) The Role of Parathyroid Hormone (PTH) and Calcium in Making Sense of the Number
Vitamin D doesn’t act alone. It influences calcium absorption, and the endocrine system continuously monitors calcium status. When vitamin D is low, PTH may rise to maintain serum calcium—an adaptation that can come at a cost to bone remodeling dynamics over time.
If your report includes PTH, that value can help interpret borderline results. If calcium is low or high, it can add another layer of context, though vitamin D deficiency is not the only explanation.
In narrative terms: PTH can be the “plot twist” that reveals your body is working harder to keep mineral balance. Pairing 25(OH)D with these indicators often produces a more coherent clinical storyline.
8) When “Optimal” Is Personal: Age, Bone Risk, and Comorbidities
Optimal vitamin D is not a single universal number. Older adults may require different targets because of reduced skin synthesis efficiency and changes in bone turnover. Individuals at risk for osteoporosis or fracture may be advised to maintain higher levels than the minimum “sufficient” cutoff.
Pregnancy and breastfeeding can also alter vitamin D needs and interpretation, though the appropriate target depends on clinician guidance and individual risk profile. People with chronic kidney disease may have different vitamin D physiology; they often require tailored evaluation because conversion processes can be impaired.
These details matter because they influence dosing decisions, follow-up timing, and whether additional testing is warranted.
9) Supplementation Decisions: Translating Results Into a Practical Strategy
After interpretation, the next step is dosing logic. Many plans start with correcting a low level, then transitioning to maintenance. Dosing may involve daily or weekly regimens, sometimes using higher short-term doses under medical supervision.
Don’t treat vitamin D supplementation like a one-size ritual. Your baseline level, body weight, absorption capacity, and lifestyle all shape the appropriate approach. If you have malabsorption or take interacting medications, the required dose can differ dramatically.
Most importantly, vitamin D supplementation should not be “set and forget.” Rechecking the level after an interval is often the only way to confirm that the chosen strategy is working in your body’s unique chemistry.
10) Follow-Up Testing: How Often to Recheck in 2025
Follow-up timing usually depends on the severity of deficiency and the treatment approach. After initiating supplementation, many clinicians recheck in a timeframe that allows the level to stabilize—often on the scale of weeks to a few months.
The goal of retesting is not perfection; it’s verification. Trends reveal more than single data points. If you were low and the number rises into a reasonable zone, that suggests the plan is effective. If it doesn’t budge, it prompts a conversation about adherence, dosage adequacy, and possible absorption barriers.
Keep your follow-up anchored to the same lab when possible, since assay variability can cloud interpretation. Consistency is a quiet superpower in longitudinal testing.
11) Red Flags and Safety: Too Much Vitamin D Can Be Harmful
While vitamin D toxicity is uncommon, it’s not impossible—especially with excessive supplementation or inadvertent stacking of multiple products. Signs of excessive vitamin D may relate to elevated calcium levels, and symptoms can include nausea, weakness, frequent urination, confusion, or kidney stress.
For that reason, it’s wise to avoid megadose practices without clinician oversight, particularly if you have kidney disease, hyperparathyroidism, sarcoidosis, or a history of kidney stones.
Safety is a sentence-long checklist: verify dose, check totals from all sources, monitor labs as advised, and adjust based on results rather than guesswork.
12) What Different Readers Can Expect: Scenarios and “Next Steps”
Interpreting a vitamin D test becomes easier when you map your likely scenario to an action path:
If your result is low: expect a correction phase, possible consideration of PTH or calcium, and a follow-up plan.
If it’s borderline: expect lifestyle reinforcement, supplementation consideration, and retesting to confirm upward momentum.
If it’s sufficient: expect maintenance thinking, seasonal awareness, and attention to risk factors that could cause drift.
If it doesn’t respond to supplementation: expect an evaluation for absorption issues, adherence barriers, and medication interactions.
These scenarios form a practical continuum. One number can be interpreted in multiple ways, but each pathway has a clear rationale.

Your vitamin D blood test is a map, not a verdict. Read it with attention to units, reference categories, and contextual markers like PTH and calcium. Then translate the number into a personalized plan—one that considers your biology, your risks, and your ability to maintain healthy levels across time.