
It’s one of those questions that appears quietly on the way to a routine blood test: “Why do my results talk about vitamin D in general, yet my supplements come in two different forms—D2 and D3?” You might notice that lab reports often speak a single language, while the bottle in your kitchen uses a different dialect. And beneath that mismatch lies a surprisingly fascinating physiology story—one that explains why two compounds that seem nearly identical in everyday conversation can behave differently inside the body.
Why blood tests look “similar” even when D2 and D3 aren’t
Most standard blood tests measure 25-hydroxyvitamin D, often written as 25(OH)D. This is the storage-and-transport form of vitamin D, not the active hormone itself. The key point: both vitamin D2 and vitamin D3 ultimately feed into the same major measurable reservoir—so your report may present one overall value rather than two separate numbers.
That’s why the common observation happens: people assume D2 and D3 must be interchangeable because their blood tests appear to converge into a single figure. Yet the “single figure” is more like an airport sign than a whole travel itinerary. It tells you where the luggage ends up, not how it got there or how efficiently it was moved across the body’s biochemical checkpoints.
Sometimes, more specialized assays can distinguish between D2-derived and D3-derived metabolites, but many routine tests do not. So you receive an aggregate picture—useful, but not always diagnostic of the nuances you’re actually curious about.

What D2 and D3 actually are, at the molecular level
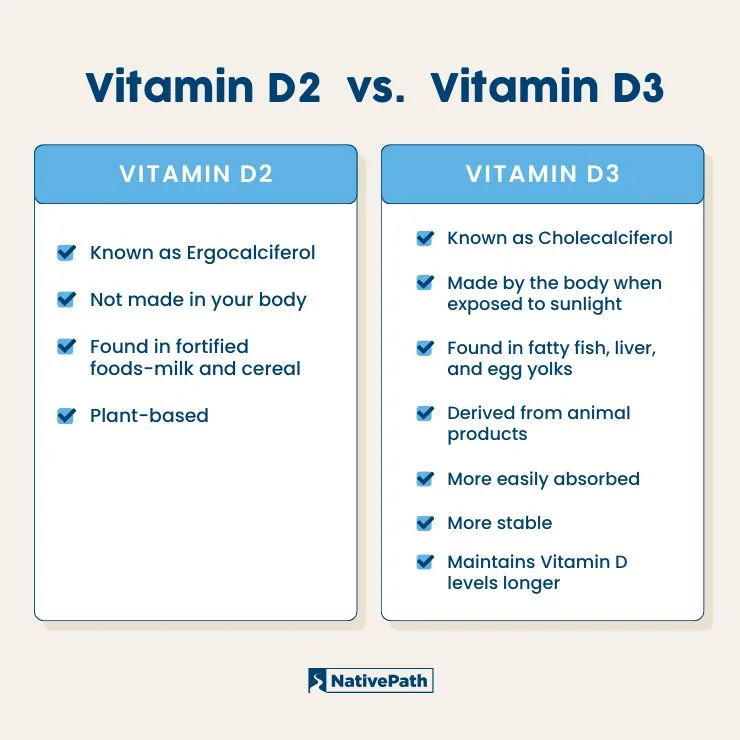
Vitamin D is a family of compounds that begin their lives in different ways. Vitamin D3—cholecalciferol—can be synthesized in human skin through ultraviolet exposure and is also present in some animal-based foods. Vitamin D2—ergocalciferol—often originates from plant or fungal sources.
They differ slightly in their chemical structure. Those small structural variations can influence how each form is processed in the liver and how persistently it remains in circulation. In other words, they may both support the same physiological “mission,” but they don’t take the same route through the body’s metabolic road network.
That difference in origin and structure matters because vitamin D’s journey is not a straight line. It includes conversion steps, binding proteins, receptor interactions, and eventual clearance. Tiny changes can become meaningful when magnified by time, dosage patterns, and individual metabolism.
How your liver and bloodstream treat these two forms differently
After intake, both D2 and D3 are processed to 25(OH)D, which is what your blood test commonly reads. However, research and clinical experience often suggest that D3 has a tendency to raise and maintain 25(OH)D levels more reliably for many people.
One reason may involve differences in affinity and stability during transport. Vitamin D metabolites circulate bound to specific carrier proteins. If one metabolite binds more effectively or is less prone to certain clearance pathways, it may linger longer in the measurable pool.
Another reason is conversion dynamics: downstream handling in the liver can differ subtly. The body’s enzymatic systems are not just mechanical converters; they are regulated, and regulation varies with genetics, nutrition status, inflammation, and even baseline vitamin D levels.
So while the blood test looks unified, the internal mechanics behind the number may not be.
The role of binding proteins and “availability” beyond the lab number
Even within the same measured 25(OH)D total, the functional reality may diverge. Vitamin D in the circulation is not simply “free” and waiting to act; it’s largely carried by proteins that shuttle it through the bloodstream.
Those binding proteins influence how much vitamin D is accessible for cellular uptake and receptor activation. Two individuals can share similar 25(OH)D totals yet experience different biological effects if the distribution between protein-bound and bioavailable fractions differs.
This is where the fascination deepens: blood tests may quantify the visible tip of an iceberg, while the iceberg’s submerged mass—bioavailability, receptor signaling readiness, and downstream gene transcription—can vary.
Common lab patterns: what you might see when switching from D2 to D3
People often compare results before and after changing supplementation strategies. A typical scenario goes like this: you take vitamin D2 for a while, recheck your level, and the number rises—but perhaps not as dramatically as expected. Then you switch to D3, continue dosing, and notice a more satisfying increase, or a steadier plateau.
That pattern can reflect differences in how each form contributes to the pool of 25(OH)D over time. It can also reflect adherence patterns (D2 is sometimes taken less frequently) and how the schedule interacts with your body’s clearance rates.
It’s worth emphasizing that individual responses are not uniform. Some people do well with D2, particularly if dosing is appropriate and consistent. The lab number is a feedback loop, not a moral judgment.
Dosage schedules: weekly vs daily and why timing changes interpretation
Vitamin D2 is often prescribed or supplemented on a weekly rhythm, while D3 may be used daily in many personal routines. The bloodstream can respond dynamically: a dose produces a rise, then levels gradually settle. If you test right after a dose versus near the end of the dosing interval, the number can look different even if the underlying trend is comparable.
This creates a subtle interpretive trap. A single test snapshot may reflect timing more than long-term effectiveness. It’s like judging a tide by one wave rather than tracking the coastline.
To understand your response, it helps to test consistently—same time of day, similar interval relative to the last dose, and ideally after a comparable duration of supplementation.
Conversion to the active form: the “on switch” is not the 25(OH)D value
25(OH)D is a marker of vitamin D stores, but the active hormone—calcitriol—is produced through additional conversion steps in the body, especially in the kidneys. Your blood test typically measures the storage level, not the final activation efficiency.
So even if D2 or D3 influences your 25(OH)D differently, downstream conversion can also be influenced by kidney function, magnesium status, calcium balance, parathyroid hormone levels, and inflammatory signaling.
That’s a deeper reason for the ongoing curiosity: vitamin D is both a nutrient and a hormone-like regulator. Your measured lab value is one chapter; your active physiology is another.
Absorption, fat metabolism, and “why” some people respond sluggishly
Vitamin D is fat-soluble. Absorption can depend on dietary fat, bile flow, gastrointestinal health, and even gut microbiome effects. If absorption is suboptimal, the form you choose may matter less than the fact that less of either form reaches circulation.
Conditions such as malabsorption syndromes, bariatric surgery history, chronic liver disease, or certain medications affecting fat absorption can blunt the rise in 25(OH)D. In those cases, clinicians may adjust dosing strategy, monitor more closely, and sometimes investigate contributors like magnesium deficiency—because magnesium supports enzymatic processes involved in vitamin D metabolism.
Thus, D2 vs D3 becomes part of a broader metabolic mosaic rather than a standalone contest.
Safety, monitoring, and the principle of “enough, not excessive”
Vitamin D can be safe and beneficial when dosed thoughtfully. But higher isn’t always better. Over-supplementation can lead to hypercalcemia in susceptible individuals, and it can happen regardless of whether you choose D2 or D3—especially when combined with high dietary calcium or other supplements.
Blood tests help calibrate. Typical monitoring includes 25(OH)D levels, and sometimes calcium, phosphate, and parathyroid hormone depending on clinical context. The goal isn’t just a number; it’s adequate vitamin D signaling without overshooting.

So which one changes the blood test more?
For many people, D3 tends to be associated with more durable improvements in 25(OH)D levels. But “tends to” is the operative phrase. Your response can vary based on absorption, baseline deficiency severity, dosing frequency, metabolic factors, genetics, inflammation, and the timing of the test relative to supplementation.
If your goal is to interpret your blood test intelligently, focus on the pattern rather than the stereotype. Compare like with like: same lab method when possible, consistent timing, and adequate duration to reach a steady state.
And perhaps the most human takeaway: the reason D2 vs D3 captures attention is because it reflects a broader truth about biology. The body can measure one number while experiencing many subtleties—chemical routing, carrier dynamics, conversion efficiency, and cellular readiness.
Practical next steps for interpreting your own results
If you’re reviewing vitamin D on a blood test, note the exact analyte reported (usually 25(OH)D). If possible, track your level over time rather than relying on a single measurement. When changing supplements, give your regimen enough time to stabilize. Keep your dosing consistent, and consider whether your test timing aligns with your dosing schedule.
If results don’t move as expected, ask deeper questions: Are you absorbing the supplement? Are you taking it with adequate dietary fat? Are there conditions or medications that impair vitamin D metabolism? Do your calcium and parathyroid hormone levels tell a coherent story?
Vitamin D2 and D3 may look like twin characters on a lab report. But once you look behind the curtain, they behave like two different narrators—each delivering the same theme, with distinct pacing, persistence, and resonance across the body’s biochemical stage.